Monday, January 4, 2010

Results for 2009 and what are we going to do this year?

Average profit of +29% for 2009
With our free trade alerts you could have made an average of +29% per alert this year. Also Great Panther Resources Ltd and Romarco Minerals Inc. that are still running are added to this average.

Watch out
Your profit will be a bit less since the transaction costs are not included and also the spread -bid and ask price- is not weighed into the calculation, just the price on the boards when the position is closed. Please read our disclaimer.

All alerts where profitable
All our closed alerts made you a profit, so no losers at all.

Watch out this is exceptional. Because we will now have a whole year it can always happen that there are less profitable or even losing trades, let me be clear about that. All traders have losses, it is that simple! And that is ok, as long as you take your loss -when you are down between 1% or 2% of your total portfolio- and move on.

Happy
We are happy and I hope you are too and we will do all we can to also make 2010 a profitable year.

What are our plans for this year?
Giving trade alerts is not the only thing we do, we will also add new articles about trading. Point you to nice tools or other sites, in short all what we can to make it easier for you to get around in the markets and become a better trader.


Marketclub - Free Great panther resources limited Trend Analyse

Links of interest

Romarco drills 33.5 meters of 4.3 g/t gold.

Update on 2009 drilling program

TORONTO, Jan. 4 /PRNewswire-FirstCall/ - ROMARCO MINERALS INC. (TSXV: R) (the "Company") is pleased to announce recent assay results and an update on the 2009 exploration program at the Haile Gold Mine, in South Carolina. These intercepts continue to demonstrate the expansion of gold mineralization at Haile.

Approximately 73,000 meters (236,000 feet) in 223 holes were drilled as part of the 2009 exploration program. The Company has assays pending for approximately 60 drill holes. Currently drilling is being conducted in outlying areas in order to select site facilities for the plant, tailings and waste dumps pursuant to the current feasibility that is underway. Drilling in three of the five proposed tailings sites identified gold mineralization. Drilling on the fourth site is approximately thirty percent complete and although gold mineralization has been encountered it is not yet sufficient to eliminate the site for facilities or tailings disposal. These results are a further indication that the mineralized zone is continuing to grow and remains open in all directions and at depth. Recent drilling demonstrates that the mineralization not only continues along strike in an east-west direction but is continuing to extend to the north as evidenced through recent condemnation drilling for site facilities. The Company's technical team is analyzing recently received assay data and will be disclosing those results and interpretations in the near future.

RC-1669 was drilled as a step-out hole in the area where the Ledbetter and Snake pits merge. RC-1669 encountered 33.5 meters (110 feet) of 4.3 g/t Au (0.126 opt) at 213.4 meters (700 feet). The hole was designed as a step-out in order to extend this mineralized zone to the north. The hole flattened out sooner than anticipated therefore the total distance from known mineralization was approximately 21 meters (70 feet). Additional holes stepping beyond RC-1669 have been planned. RC-1663 encountered 29.0 meters (95 feet) of 1.1 g/t Au (0.034 opt) at 7.6 meters (25 feet). RC-1663 was drilled as a step-out hole approximately 45 meters (150 feet) along the far western edge of the property (Champion area). RC-1663 demonstrates the continued possibility of finding additional near surface mineralization within the Haile mine area and confirms the mineralized zone remains open to the west. The results of these holes are summarized in the table below.

-------------------------------------------------------------------------
                   Interval           From             To           Gold
Hole (meters) (meters) (meters) (g/t)
-------------------------------------------------------------------------

-------------------------------------------------------------------------
RC-1663
-------------------------------------------------------------------------
Interval 29.0 7.6 36.6 1.1
-------------------------------------------------------------------------
RC-1669
-------------------------------------------------------------------------
Interval 33.5 213.4 246.9 4.3
-------------------------------------------------------------------------

With five drill rigs on site (four RC and one core rig), the current program is designed to identify additional resources and convert resources into proven and probable reserves across the entire mine property. Drilling is being performed by Boart Longyear, Romarco's company owned drill, and Connors drilling. The drill samples are being assayed by Alaska Assay Labs in Fairbanks, AK. Blank samples as well as third party standards were submitted with all of the drill holes. The results of the control samples were within acceptable ranges and adjacent to the mineralized zones. Romarco's Qualified Person under NI-43-101 is Peter J. Butterfield.

About Romarco Minerals Inc.
---------------------------

Romarco Minerals Inc. is a gold development company focused on production in the US and Mexico. The Company's flagship project is the Haile Gold Mine in South Carolina which is currently undergoing exploration drilling, bankable feasibility study and permitting. The Pinos Gold District in Mexico is a high grade epithermal vein district in the advanced exploration stage.

Please note:

This entire press release may be accessed via fax, e-mail, Romarco's website at www.romarco.com and through CNW Group's website at www.newswire.ca. All material information on Romarco Minerals Inc. can be found at www.sedar.com

    -------------------------------------------------------------------------
"Neither the TSX Venture nor its regulation services provider (as that
term is defined in the policies of the TSX Venture Exchange) accepts
responsibility for the adequacy or accuracy of this release"

SOURCE ROMARCO MINERALS INC.


YeOldGoldNugget's links of interestTrend Analysis
Get the most recent Trend Analysis on Romarco Minerals Inc. by following this link :
Marketclub - Romarco Minerals Inc. Trend Analysis Marketclub - Romarco Minerals Inc. Trend Analysis (What's this?)

Sunday, January 3, 2010

Update Platinum Group Metals Limited and Great Panther Resources

2009 Copyright Northwest Territorial Mint - Credit Suisse 5 Gram Platinum Bar
As you will probably know I mostly follow the metals like platinum, palladium, silver and gold or the mining stocks.

Platinum Group Metals Limited TSE:PTM
Again this month the price shoots straight up and we get an extra year-end bonus of +38.22%

Platinum and palladium hit three-week highs Thursday after Securities and Exchange Commission filings showed that exchange-traded funds for these metals in the U.S. moved one step closer to reality. Read all about it here PRECIOUS METALS: Nymex Platinum, Palladium Lifted By ETF News.

Marketclub - Free Platinum Group Metals Limited Trend Analysis

Great Panther Resources Ltd TSE:GPR
This wil go up and down a bit before it will hit 0.9$ or 1$, so sit thight and give it some time to get there and give you a fat profit. Current profit: -1.12% so together with Platinum Group metals a fat profit of +37.1%.

Marketclub - Free Great panther resources limited Trend Analysis

Links of interest

Sunday, December 27, 2009

Predict a top or bottom


A lot of traders try to predict a top or bottom in the stock market and many fail doing so and  you will end up with a loss.

When you try to buy at the lowest price, then the price declines even further or the price doesn't move at all and your money is locked up for a longer period.

When you try to predict a top then mostly you are wrong and the top is a bit higher, and you being short are making a loss since the top is a bit higher as expected.

The bottom line is, look at what the market is doing and follow that move.

Links of interest

Wednesday, December 16, 2009

Alert Great Panther Silver Limited TSE:GPR

Weekly chart


You can go long on Great Panther Silver Limited.
Marketclub - Great Panther Silver Limited Trend Analysis, it is free, so try it.

I want to shine some more more light on how to trade the medium to longer term and for that I will use Great Panther Silver Limited GPR.TO to clarify this. Most of the alerts that I have given since august on this blog, were short trades of a couple days, up to 10 days. And that is not at all terrible, because all those alerts have produced on average a profit of 20%. I am satisfied about the past results and I hope you are also?

But I want to continue to better my techniques and educate myself more, and also, I want to focus a bit more on the middle to longer term trades. And this to be able to score the big profits.

By this, I do not mean to say that all new trades will be middle to long term trades, but if possible from time to time a trade like that will be posted.

On to the chart, what we do is, firstly we take a look at the weekly chart. I always do so to make sure I get a clear view of where we are. Always make sure to look at different time frames, so that would be for instance the daily, the weekly, the monthly, 6-months, year, 5-year,...to get a better understanding of the stock.

OK, on to our analysis of our Silver Mexican Panther. I've added some lines on the chart to visualize where we are.
  • First, we have support 1 which is a trend line on which our Panther slowly but steadily moves upwards on.

  • Second, we try to find where the MA 30 sort off flattens out (light blue line) which was somewhere around May 2009. The price of the stock must be above this line before we even attempt a purchase.

  • We draw a new line above all our highs namely resistance 2.

  • Somewhere around June we saw a first breakout, our Panther doesn't seem to find enough sustenance at these lower plains and has to move up to higher country and does so on three times more volume. It would seem our Panther has put on some muscle since then which must be from walking the support 1 trend line.

  • In July there was the usual re-test, well you know how it is. Maybe the Panther got a bit nostalgic, longing for times gone by but on the march back down realization struck and our Panther realized the reason why it left those lower plains. Not enough food there. So up it went again.

    Actually this would have been a great moment to make an entry into the stock. Sometimes investors will invest half of what they intended to invest when a breakout occurs. Then, when the stock pulls back or does its re-test then the second amount gets added to the already existing position.

  • Maybe good that that time has passed and we are seeing a new entry appearing.

  • We notice a very high volume in November which is a whopping 9.7 miljoen and it seems our Panther is trying to break resistance 3.

Why the trade?

If you read the analysis then you will understand that the course of events for Great Panther are as one would like to see...very favorable. We also see a Symmetrical Continuation Triangle (Bullish). Great Panther is a strong growing silver producer in Mexico with a lot going for it. Only recently they acquired a new project :
Great Panther Acquires Strategic Claim at Topia
Another point to look at is the price of silver which also seems to be on a path to earlier highs which would be bullish for juniors leveraged in silver. Our intention is for Great Panther to be a long term hold.

Great Panther Silver Limited - Building a Profitable Mid-Tier Silver Producer
Current price
0.89

Target
First a break out, after that 1.4$

Links
Great panther website

Buy gold online - quickly, safely and at low prices
Links of interest
Buy gold online - quickly, safely and at low prices

Friday, December 4, 2009

Running man, still running but for how long?

Nasdaq Daily Chart
Nasdaq Daily Chart December 04, 2009
Chart is courtesy of marketclub.
Marketclub - Nasdaq Trend Analysis.

I want to zoom in on some runners that are getting a bit out of breath.

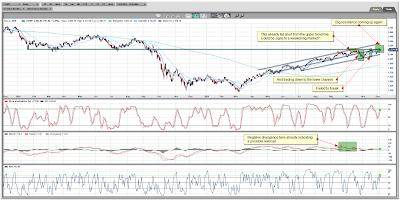
Mount EverestSince early March our little running man has been heading up the mountain, heading higher and higher, like the good athlete he is, what started out as running has now after months become more like a steady crawl. Since mid-October this little athlete became a little bit exhausted.

He has been running for so long only to see his efforts leaving him still miles and miles short and plenty still to go before ever reaching the top of the mountain. His body and his joints feel like giving up. Chart wise we see a divergence in the MACD.  Our runner also seems to think going up a mountain means taking a lower path before eventually going higher? Seems an odd direction to take when ones desire is to reach the top? Since late September however, a lower channel was chosen.

Whether this is a shortcut to the top or a run for the foot of the mountain. I honestly don't know, just telling you what my satellite system is telling me. These mountaineers sure have a funny way of climbing up a mountain I tell you! But, since I'm neither Mounty nor mountaineer I have no way of telling you whether that is normal behavior or whether we should call a helicopter rescue. Lets just wait and see.

Take a look at the free: Marketclub - Nasdaq Trend Analysis.

S&P 500 daily

S&P Daily Chart December 04, 2009
Chart is courtesy of marketclub

This running man already bashed his head against a wall of resistance. Chart wise we see a divergence in the MACD and also the RSI is declining. So to help this exhausted runner through the month of December with all the detours he will have to make to buy presents -maybe taking a lower path to shop a bit cheaper- I have for you a video you can have a look at.

In this video you can see the exact points that you can take a look at to determine if a change in the trend is happening in the S&P 500.
Take a look at the video.
Take a look at the free: Marketclub - S&P Index Trend Analysis

Advice
Stay out of long positions on these runners.

Monday, November 30, 2009

Alert: Romarco Minerals and Acadian Mining Corporation

A lot of indexes are getting in the overbought territory, also the metals are doing strange jumps (gold, palladium, platinum) so for now I would advise staying away at least from the US stock market when you want to go Long.


Romarco Minerals CVE:R
If you would like a gold play then you can take a look at Romarco Minerals. A lot of stocks are going down, and this one has been going up steadily.

Current price: 1.73

If you buy this, expect to keep it for the long run.

Marketclub - Romarco Minerals Trend Analysis, it is free.

Acadian Mining Corporation TSE:ADA
Acadian Mining Corporation (Acadian) is a Canada-based mining, exploration, and development company based in Halifax, Nova Scotia..

They got rid of there debt and are trading between 0.07 and 0.10. This stock traded in november 2008 around 1.11$. Resistance is at 0.06$.

Current price: 0.08

When you buy this, please just use only a small portion of your account. It is possible that you will have to wait a few months before it starts to move. This is just a buy and hold for a longer time. Just get your foot in the water a bit.

Marketclub - Acadian Mining Corporation Trend Analysis, it is free.

Sunday, November 22, 2009

Alert Palladium long


Maybe a bit late because the trade has already been closed but I just like to keep a record. I would like to advise that you also keep a record of all your trades.

Yes I know that is a lot of work, but what will you do when every month you see that your account goes down the drain a bit more? Yes, you look up all your trades that you have written down, and do a bit of research where you went wrong. And maybe you see a pattern and can improve your trading.

With this trade I did ok and had a profit of 20.6% with a leverage between 3 and 4. But I could have waited just a bit longer and see if the trend line would break and when it did, stay in the trade a bit longer. I closed the position because I can't trade 24 hours a day so when palladium would go down big time during the night, I would wake up and see halve or more of the profit gone up in flames. Well I also just could have looked at the ATR (Average true range) and calculated what on average I could loose during the night and then consider staying in or not.

I always analyze a trade afterwards and try to learn from it, you can ask the following questions:
  • Was my entry to late or early?
  • Was my exit to late or early?
  • What are the indicators telling me like MACD, Stochatics, and so on?
  • Can I do this trade again real soon?
    When there is a correction to a trend line, and it bounces then you possibly can trade this position again.
  • Are we near some resistance?
  • When I look at Fibonacci how far are we in the decline or rise?

Wednesday, November 11, 2009

What’s Gold’s Next Stop?

Sunday, November 8, 2009

Alert: Rock Energy Inc TSE:RE


Chart is courtesy of marketclub.
Marketclub - Rock Energy Inc. Trend Analysis.

Position
You can take a long position on Rock Energy Inc TSE:RE

Rock Energy Announces Closing of a $15 Million Bought Deal Financing.You can read here what a bought deal is, and why it is important.

Current price: 3.5$

Chart
When we look at the weekly chart we see that a lot of indicators are positive
  • we have an increased volume
  • the RSI and the MACD is positive.
  • MA10 and MA30 are pointing up
  • prices are also trading above the MA200 and it is only slightly pointed down. On the daily chart it points up.
Resistance
If we go over the previous peak of  3.55$ then I see resistance around 4.5$ so a possible 28% profit if prices will go there again.

If we go almost to 4.5$ I would lock in some profit around 4.3$, or place a stop loss order around that price range.

Buy gold online - quickly, safely and at low prices