Nasdaq Daily Chart
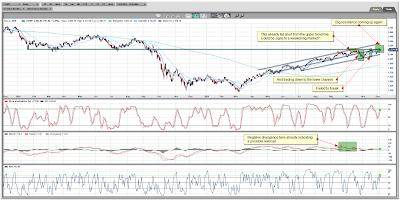
Chart is courtesy of marketclub.
Marketclub - Nasdaq Trend Analysis.
I want to zoom in on some runners that are getting a bit out of breath.
 Since early March our little running man has been heading up the mountain, heading higher and higher, like the good athlete he is, what started out as running has now after months become more like a steady crawl. Since mid-October this little athlete became a little bit exhausted.
He has been running for so long only to see his efforts leaving him still miles and miles short and plenty still to go before ever reaching the top of the mountain. His body and his joints feel like giving up. Chart wise we see a divergence in the MACD. Our runner also seems to think going up a mountain means taking a lower path before eventually going higher? Seems an odd direction to take when ones desire is to reach the top? Since late September however, a lower channel was chosen.
Whether this is a shortcut to the top or a run for the foot of the mountain. I honestly don't know, just telling you what my satellite system is telling me. These mountaineers sure have a funny way of climbing up a mountain I tell you! But, since I'm neither Mounty nor mountaineer I have no way of telling you whether that is normal behavior or whether we should call a helicopter rescue. Lets just wait and see.
Take a look at the free: Marketclub - Nasdaq Trend Analysis.
S&P 500 daily

This running man already bashed his head against a wall of resistance. Chart wise we see a divergence in the MACD and also the RSI is declining. So to help this exhausted runner through the month of December with all the detours he will have to make to buy presents -maybe taking a lower path to shop a bit cheaper- I have for you a video you can have a look at.
In this video you can see the exact points that you can take a look at to determine if a change in the trend is happening in the S&P 500.
Advice
Stay out of long positions on these runners.

Chart is courtesy of marketclub.
Marketclub - Nasdaq Trend Analysis.
I want to zoom in on some runners that are getting a bit out of breath.
 Since early March our little running man has been heading up the mountain, heading higher and higher, like the good athlete he is, what started out as running has now after months become more like a steady crawl. Since mid-October this little athlete became a little bit exhausted.
 He has been running for so long only to see his efforts leaving him still miles and miles short and plenty still to go before ever reaching the top of the mountain. His body and his joints feel like giving up. Chart wise we see a divergence in the MACD. Our runner also seems to think going up a mountain means taking a lower path before eventually going higher? Seems an odd direction to take when ones desire is to reach the top? Since late September however, a lower channel was chosen.
Whether this is a shortcut to the top or a run for the foot of the mountain. I honestly don't know, just telling you what my satellite system is telling me. These mountaineers sure have a funny way of climbing up a mountain I tell you! But, since I'm neither Mounty nor mountaineer I have no way of telling you whether that is normal behavior or whether we should call a helicopter rescue. Lets just wait and see.
Take a look at the free: Marketclub - Nasdaq Trend Analysis.
S&P 500 daily

Chart is courtesy of marketclub
In this video you can see the exact points that you can take a look at to determine if a change in the trend is happening in the S&P 500.
Take a look at the video.
Take a look at the free: Marketclub - S&P Index Trend AnalysisAdvice
Stay out of long positions on these runners.


