Sunday, December 27, 2009

Predict a top or bottom


A lot of traders try to predict a top or bottom in the stock market and many fail doing so and  you will end up with a loss.

When you try to buy at the lowest price, then the price declines even further or the price doesn't move at all and your money is locked up for a longer period.

When you try to predict a top then mostly you are wrong and the top is a bit higher, and you being short are making a loss since the top is a bit higher as expected.

The bottom line is, look at what the market is doing and follow that move.

Links of interest

Wednesday, December 16, 2009

Alert Great Panther Silver Limited TSE:GPR

Weekly chart


You can go long on Great Panther Silver Limited.
Marketclub - Great Panther Silver Limited Trend Analysis, it is free, so try it.

I want to shine some more more light on how to trade the medium to longer term and for that I will use Great Panther Silver Limited GPR.TO to clarify this. Most of the alerts that I have given since august on this blog, were short trades of a couple days, up to 10 days. And that is not at all terrible, because all those alerts have produced on average a profit of 20%. I am satisfied about the past results and I hope you are also?

But I want to continue to better my techniques and educate myself more, and also, I want to focus a bit more on the middle to longer term trades. And this to be able to score the big profits.

By this, I do not mean to say that all new trades will be middle to long term trades, but if possible from time to time a trade like that will be posted.

On to the chart, what we do is, firstly we take a look at the weekly chart. I always do so to make sure I get a clear view of where we are. Always make sure to look at different time frames, so that would be for instance the daily, the weekly, the monthly, 6-months, year, 5-year,...to get a better understanding of the stock.

OK, on to our analysis of our Silver Mexican Panther. I've added some lines on the chart to visualize where we are.
  • First, we have support 1 which is a trend line on which our Panther slowly but steadily moves upwards on.

  • Second, we try to find where the MA 30 sort off flattens out (light blue line) which was somewhere around May 2009. The price of the stock must be above this line before we even attempt a purchase.

  • We draw a new line above all our highs namely resistance 2.

  • Somewhere around June we saw a first breakout, our Panther doesn't seem to find enough sustenance at these lower plains and has to move up to higher country and does so on three times more volume. It would seem our Panther has put on some muscle since then which must be from walking the support 1 trend line.

  • In July there was the usual re-test, well you know how it is. Maybe the Panther got a bit nostalgic, longing for times gone by but on the march back down realization struck and our Panther realized the reason why it left those lower plains. Not enough food there. So up it went again.

    Actually this would have been a great moment to make an entry into the stock. Sometimes investors will invest half of what they intended to invest when a breakout occurs. Then, when the stock pulls back or does its re-test then the second amount gets added to the already existing position.

  • Maybe good that that time has passed and we are seeing a new entry appearing.

  • We notice a very high volume in November which is a whopping 9.7 miljoen and it seems our Panther is trying to break resistance 3.

Why the trade?

If you read the analysis then you will understand that the course of events for Great Panther are as one would like to see...very favorable. We also see a Symmetrical Continuation Triangle (Bullish). Great Panther is a strong growing silver producer in Mexico with a lot going for it. Only recently they acquired a new project :
Great Panther Acquires Strategic Claim at Topia
Another point to look at is the price of silver which also seems to be on a path to earlier highs which would be bullish for juniors leveraged in silver. Our intention is for Great Panther to be a long term hold.

Great Panther Silver Limited - Building a Profitable Mid-Tier Silver Producer
Current price
0.89

Target
First a break out, after that 1.4$

Links
Great panther website

Buy gold online - quickly, safely and at low prices
Links of interest
Buy gold online - quickly, safely and at low prices

Friday, December 4, 2009

Running man, still running but for how long?

Nasdaq Daily Chart
Nasdaq Daily Chart December 04, 2009
Chart is courtesy of marketclub.
Marketclub - Nasdaq Trend Analysis.

I want to zoom in on some runners that are getting a bit out of breath.

Mount EverestSince early March our little running man has been heading up the mountain, heading higher and higher, like the good athlete he is, what started out as running has now after months become more like a steady crawl. Since mid-October this little athlete became a little bit exhausted.

He has been running for so long only to see his efforts leaving him still miles and miles short and plenty still to go before ever reaching the top of the mountain. His body and his joints feel like giving up. Chart wise we see a divergence in the MACD.  Our runner also seems to think going up a mountain means taking a lower path before eventually going higher? Seems an odd direction to take when ones desire is to reach the top? Since late September however, a lower channel was chosen.

Whether this is a shortcut to the top or a run for the foot of the mountain. I honestly don't know, just telling you what my satellite system is telling me. These mountaineers sure have a funny way of climbing up a mountain I tell you! But, since I'm neither Mounty nor mountaineer I have no way of telling you whether that is normal behavior or whether we should call a helicopter rescue. Lets just wait and see.

Take a look at the free: Marketclub - Nasdaq Trend Analysis.

S&P 500 daily

S&P Daily Chart December 04, 2009
Chart is courtesy of marketclub

This running man already bashed his head against a wall of resistance. Chart wise we see a divergence in the MACD and also the RSI is declining. So to help this exhausted runner through the month of December with all the detours he will have to make to buy presents -maybe taking a lower path to shop a bit cheaper- I have for you a video you can have a look at.

In this video you can see the exact points that you can take a look at to determine if a change in the trend is happening in the S&P 500.
Take a look at the video.
Take a look at the free: Marketclub - S&P Index Trend Analysis

Advice
Stay out of long positions on these runners.

Monday, November 30, 2009

Alert: Romarco Minerals and Acadian Mining Corporation

A lot of indexes are getting in the overbought territory, also the metals are doing strange jumps (gold, palladium, platinum) so for now I would advise staying away at least from the US stock market when you want to go Long.


Romarco Minerals CVE:R
If you would like a gold play then you can take a look at Romarco Minerals. A lot of stocks are going down, and this one has been going up steadily.

Current price: 1.73

If you buy this, expect to keep it for the long run.

Marketclub - Romarco Minerals Trend Analysis, it is free.

Acadian Mining Corporation TSE:ADA
Acadian Mining Corporation (Acadian) is a Canada-based mining, exploration, and development company based in Halifax, Nova Scotia..

They got rid of there debt and are trading between 0.07 and 0.10. This stock traded in november 2008 around 1.11$. Resistance is at 0.06$.

Current price: 0.08

When you buy this, please just use only a small portion of your account. It is possible that you will have to wait a few months before it starts to move. This is just a buy and hold for a longer time. Just get your foot in the water a bit.

Marketclub - Acadian Mining Corporation Trend Analysis, it is free.

Sunday, November 22, 2009

Alert Palladium long


Maybe a bit late because the trade has already been closed but I just like to keep a record. I would like to advise that you also keep a record of all your trades.

Yes I know that is a lot of work, but what will you do when every month you see that your account goes down the drain a bit more? Yes, you look up all your trades that you have written down, and do a bit of research where you went wrong. And maybe you see a pattern and can improve your trading.

With this trade I did ok and had a profit of 20.6% with a leverage between 3 and 4. But I could have waited just a bit longer and see if the trend line would break and when it did, stay in the trade a bit longer. I closed the position because I can't trade 24 hours a day so when palladium would go down big time during the night, I would wake up and see halve or more of the profit gone up in flames. Well I also just could have looked at the ATR (Average true range) and calculated what on average I could loose during the night and then consider staying in or not.

I always analyze a trade afterwards and try to learn from it, you can ask the following questions:
  • Was my entry to late or early?
  • Was my exit to late or early?
  • What are the indicators telling me like MACD, Stochatics, and so on?
  • Can I do this trade again real soon?
    When there is a correction to a trend line, and it bounces then you possibly can trade this position again.
  • Are we near some resistance?
  • When I look at Fibonacci how far are we in the decline or rise?

Wednesday, November 11, 2009

What’s Gold’s Next Stop?

Sunday, November 8, 2009

Alert: Rock Energy Inc TSE:RE


Chart is courtesy of marketclub.
Marketclub - Rock Energy Inc. Trend Analysis.

Position
You can take a long position on Rock Energy Inc TSE:RE

Rock Energy Announces Closing of a $15 Million Bought Deal Financing.You can read here what a bought deal is, and why it is important.

Current price: 3.5$

Chart
When we look at the weekly chart we see that a lot of indicators are positive
  • we have an increased volume
  • the RSI and the MACD is positive.
  • MA10 and MA30 are pointing up
  • prices are also trading above the MA200 and it is only slightly pointed down. On the daily chart it points up.
Resistance
If we go over the previous peak of  3.55$ then I see resistance around 4.5$ so a possible 28% profit if prices will go there again.

If we go almost to 4.5$ I would lock in some profit around 4.3$, or place a stop loss order around that price range.

Thursday, November 5, 2009

Should You Manage Your Own Portfolio?

PortfolioBy David Bogoslaw

Focus on Stocks

Avi Horowitz, vice-president of volunteer training and support for the Better Investing Volunteer Advisory Board, agrees that the idea of "not being in this alone" has gained traction because of the fear in the marketplace. BetterInvesting and the NAIC have 88 local chapters across the U.S. that help teach members the basic tenets and techniques of investing for $79 a year, usually through online forums. The online stock study team meets the first Wednesday of each month, and those sessions are recorded and available in online archives.

Unfortunately, the focus of the online tools and recommendations from peers on investing sites is primarily on stocks and stock-based funds, which leaves out a lot of other asset classes that advisers say are necessary to have a well-diversified portfolio. TradeKing is one of the few sites that helps investors who want exposure to fixed income assets as well as stock options. OptionMonster.com, a subscription research site that spawned online brokerage TradeMonster.com in October 2008, and ThinkorSwim.com, which is being purchased by TD Ameritrade also do a good job of educating investors about how to trade options, says Aite's Honore.

Possibly the only investing site that comes close to advocating the same widely diversified approach as most financial advisers is Marketclub.com, which educates members about—and provides trading tools for—a wide range of assets, from U.S. and Canadian stocks and mutual funds to foreign currencies, agricultural and industrial commodities in the cash and futures markets, and government bonds.

Marketclub, which charges subscribers $449 a year, isn't an online broker but gives members what they need to trade various asset classes on their existing brokerage accounts.

Scare Rating Services


Marketclub lets users quickly identify which markets are going down or up and to discern trends in all asset classes, says Adam Hewison, the site's co-founder and a former trader on the Chicago Mercantile Exchange. He believes you don't need to make a huge time commitment to manage your own investments. You should be able to tell whether you should stay in or get out of any given asset if you spend even just an hour a week looking at your portfolio with Marketclub's tools.

While there are plenty of online and desktop tools designed to support investors, what's in short supply are ratings services akin to Consumer Reports that assess and compare these products and services. Computerized Investing, a bimonthly publication of the American Association of Individual Investors (AAII), advises readers on the best software and sites for tracking and evaluating their portfolios' performance. Back issues, archived online, can be searched by topic. The AAII Journal, which comes out 10 times a year, offers a discount brokers guide in its February issue, a guide to mutual funds in March, and a tax guide in December that allows investors to plan ahead for what they want to sell or keep, says editor Maria Scott.

It's daunting to go the DIY route. But for those brave enough to make their own investing decisions, there are plenty of resources available.

Bogoslaw is a reporter for BusinessWeek's Investing channel.

You can read the entire article here

Why Gold? Why Now?

The Case for Investing in Gold Today

IF YOU'RE LOOKING to store wealth in something both rare and secure today, you will find nothing to match gold.

Gold always tends to reward cautious savers in times of financial stress, because it is both hard to destroy and tightly supplied.

In short, it is the very opposite of debt.

Gold doesn't corrode or tarnish, and it's relatively useless to industry. That's why almost all of the entire stock of gold mined over the last 4,000 years remains unused today. It exists as either jewelry or bullion, both of which act to store wealth and value.

The world's total store of gold now stands near 160,000 tonnes. But the metal is so dense that, if formed into a single a cube, it would have an edge barely 22 yards in length.

That wouldn't even cover a tennis court!

Gold vs. Paper-Money Inflation


New gold is being found and mined today at the rate of some 2,600 tonnes per annum.

That's a modest increase of 1.6% per year to the above-ground supply. And critically for the value of gold, this annual growth-rate lies beyond the power of politicians or investment banks to increase.

The supply of Euros, in contrast — the most hawkishly-managed major world currency right now — is currently expanding by 11.5% per year.

Thanks to this tight supply, gold grew its purchasing power more than nine times over during the 1970s — the last worldwide surge in inflation. In terms of business assets, it rose 23 times over by the start of 1980 as measured against the Dow Jones Industrial Average.

During the financial collapse of the 1930s — but this time amid a deflation caused by half of all banks in the United States failing — gold bought 17 times as many financial assets as it did before the Great Crash of 1929.

Now debt defaults and inflation are working together today, forcing a fresh crisis in the value of money. Gold has already risen three-fold against the New York stock market since early 2000. It's recently turned higher in terms of residential and commercial real estate, too.

Time to Buy Gold?


Gold doesn't care whether a financial collapse destroys the value of money (inflation) or the value of debt (deflation). Its unique characteristics — indestructibility and tight supply — mean its owners can thrive amid either.

But that doesn't make gold a "forever" investment. Gold will always lose value during stable periods of strong economic growth.

Over the twenty years to 2000, for example, gold lost 95% of its value in terms of US real estate. So it's no surprise that, as a proportion of world investment portfolios, gold fell from around 2% to effectively zero.

The trend in gold prices finally turned higher at the start of this decade, just as Gordon Brown — now the British prime minister — sold half the UK's national gold reserves at less than $300 an ounce.

Since then gold has trebled and more. But this gain remains small in the context of previous gold trends. It's also been limited by Western governments persuading their citizens that "core" inflation in the cost of living is running at just 2% per year or below.

These official CPI figures, of course, exclude the cost of housing, mortgages, taxes, fuel and saving for retirement. But this trick cannot go un-noticed forever.

New Investment in Gold


New gold investment will continue to grow if the world's major currencies — gold's main competition as a store of value — plunge into the inflationary spiral that many economists fear.

Until there's a dramatic change in monetary policy, the over-supply of Dollars, Euros and Yen look set to keep pushing gold prices higher. And it took a dramatic change in central-bank policy to finally kill gold's last inflation-led surge.

At the start of the 1980s, the Federal Reserve pushed US interest rates up to 18% and above, restoring the world's confidence in its currency and kick-starting the "long boom" of the next 20 years.

Could America survive such strong medicine now? Would Ben Bernanke even dare risk it?

If you think the world's central bankers are about to set interest rates far above the real rate of inflation, you should steer well clear of gold.

But if you fear for your savings — and you want to start investing in gold — you can start today, for free, at BullionVault.

PLEASE NOTE: We will receive a small referral commission for any accounts opened through this article. But the tiny dealing fees and storage charge you will pay would be no smaller without it.

And this ground-breaking service really does give you unique access to live gold market prices, cutting out the middleman and slashing the costs of investing in gold "dramatically" as the Financial Times recently noted.

To find out for yourself, go to BullionVault - Buy Gold Online now.
Buy gold online - quickly, safely and at low prices

Tuesday, November 3, 2009

Trading Experts


If you are looking for trading experts, alerts on stocks, commodities or forex then you can check out Jim Robinson. We will add more experts, but we will start with Jim Robinson.

We spoke with Jim Robinson about trading Stocks, Commodities and Forex

EXPERT: We spoke with Jim Robinson about trading Stocks, Commodities and Forex


I was looking around for someone who knows how to trade futures and through one of my contacts I came in contact with Jim Robinson who has been trading for 30 years.

He has been writing daily email trading newsletters for over 10 years and has by now thousands of traders receiving and following his newsletters everyday.

Free and premium newsletters
If you are interested in some excellent free trading information you can sign up for his free newsletters or for his premium newsletters below:


He also gave us a nice article that I urge you to read to become a better trader, and that is what this blog is all about, getting better, having fun trading.

THINGS YOU NEED TO KNOW TO BE A SUCCESSFUL TRADER
  1. You have to have a exact trading plan.
  2. You have to believe in your trading plan.
  3. When you start trading your plan, you have to follow it - exactly.
  4. If you don't have a plan and follow it, you will not be successful trading.
1 - The trading plan
If I had to make a guess I would say most trader's probably trade their entire career without a trading plan.

Does that sound hard to believe?

Well if you don't mind, let's take a little test here .

Write down your trading plan.
A) How to enter a trade.
B) Where does the stop go.
C) Where do you take profits
.
And to me each of the above needs to be clear cut, no questions asked.

In other words anyone who followed your plan, would know exactly where to enter, where to get out, and where to take profits, at all times.

If your plan reads, I trade double bottoms, triangles, bull flags, or I use Stochastics, Moving Averages, etc. etc, I'm sorry but to me that isn't a plan, that is a hodge podge of chart patterns and technical indicators.

So let me give you an example of what I consider a trading plan, and this is just an example and is not an actual trading plan.

EXAMPLE PLAN - BUY
  1. If the market trades above the 10 day high go long.
  2. The stop if wrong is the most recent 10 day low.
  3. If the trade moves your way, use the low of the last 10 days to take profits.

A sell example would be just the opposite.

Anybody that decided to follow the example plan above would know exactly what they were going to do before they even entered the trade, and they would know exactly what to do while in the trade.

2 - Believe in your plan
This is where paper trading and testing, will come in.
If you see the plan works before you start to trade it, you will be able to stick to the rules.
If you don't have an exact plan, you will never be able to follow it, quite simply because you really have nothing to follow.

3 - Follow the rules
This is where the going gets tough, because most trader's can't follow a plan.
And quit simply that is why most traders lose.
If you have a trading plan you believe in through, paper trading and testing, you will be able to follow the rules, because you will know overall you are going to come out ahead.

4 - You can do it!
If you develop a clear cut trading plan that works, and have the will power to follow it, you will be a successful trader.

Really the big secrets to a successful system are:
  • Trade with the trend
  • Cut your losses short
  • Let your profits run
Not much of a secret, right, everybody knows that.
Here's where I believe most fail even though we all know to trade with the trend, cut losses short, and let profits run.

Trading with the trend, cutting losses short, and letting profits run, can mean almost anything to anybody and that brings us right back to what we are talking about - we have to have a plan.
  • We have to know how to define the trend.
  • We have to have a specific rule for cutting losses.
  • We have to have a specific rule for taking profits.

Well I could go on and on from here, but I am also one of those people who believes in keeping it simple, so I think this is plenty for one lesson. So please before you ever trade have an exact plan, and then when you start to trade follow it.

You can do it !

Thanks !
Jim :-)

P.S.
When you start trading and feel like you are not quite sure what to do at any given time.
The answer is, follow the plan.

Monday, November 2, 2009

Using Stage Analysis to trade the Dow Jones

Stan Weinstein wrote in his book 'Secrets For Profiting in Bull and Bear Markets' about the four stages that a stock or market could be in.

In the picture you can see the four stages, and in the next table you can read more about every stage:


Phase


Name


What do we see
Stage 1
Basing
MA 30 is turning flat and the market moves sideways.
Stage 2
Advancing
Trading above MA 30 and the market trend is up
Stage 3
Topping
We see a top in the market and MA 30 turns back flat and the market starts to trade sideways.
Stage 4
Declining
Trading dip under MA 30 and we have a downward trend

I thought, what good is a method without first trying it out in the real world? Well to show you how this Four Stage Analysis method works, I will zoom in on the Dow Jones Index, and see if it really works

A picture says more than a thousand words so please take a look at the Chart of the Dow Jones Index and read the labels to understand how you can trade the Dow Jones using this method.


I will explain it a bit more in detail. I will get into the following:
  • when can I go SHORT at a possible top and when do I exit my position?
  • when can I go LONG at a possible bottom and when do I exit my position?
When can I go SHORT at a possible top and when do I exit my position?

Advancing phase
If we look at the chart at the far left then we see phase 2 (advancing phase), so a climbing Dow Jones. Trading is above the MA30 and the line points up.

Topping
We see that after October the MA30 starts to go flat and we see sideways trading taking place. We draw a support line (support 1) at the lows of the corrections that have taken place.

Breakdown
At the beginning of 2008 support (support 1) breaks down and we see that trading dips under the MA30. This can be a good point of entry for or to take a position but most of the times there will be so-called retest of the breakdown point. So it would be better to wait for that moment.

Retest
Between April and June we see a retest and we see climbing prices up to the support line that becomes now resistance.

Go short on the DOW
We wait until trading goes under the MA30. We also see that the RSI and MACD are pointing downward. At this point we go SHORT.

A little summary:
  • there has been a top phase (flat MA30)
  • MA30 points down 
  • prices lie beneath the MA30
  • support is broken
  • we saw a retest
  • we see a further decline

When do I exit my SHORT position?
When we get back at stage 1 (base) we get out. In the graph that is around 8000$. We see that MA30 goes flat again. The MACD becomes positive and also the RSI. Really certain (what is certainty in the stock market?) are we when we get a breakout through resistance 1.

When can I go LONG at a possible bottom and when do I exit my position
This works exactly the same but then the other way around. We draw a resistance line at a possible bottom (resistance 1).

Bottom
We see here that as from April MA30 starts to go flat and that the market starts to move sideways. We draw a resistance line here (resistance 1) where a high was formed each time.

Breakout of resistance (resistance 1)
We get a first breakout at the resistance line (resistance 1).

Long on the DOW
We see that we get a retest of the breakout level and after that we see a bounce back up. We wait for this moment and also until the trading increases above the MA30 line. We also see a positive RSI  and MACD. Here we go LONG and we close our previous SHORT position.

The trading method when you go from long to short and the other way around, is called SAR, or Stop And Reverse.

Conclusion
If you used this method to trade the Dow Jones you would have made a lot of money. You only had to take 2 positions, one Short and one Long and you could have a good night's sleep. Also the method is an easy method, you have to draw support or resistance lines, and you will use a weekly chart of the market, the MA30 and you are all set. You can enhance it all by using extra indicators like the MACD and the RSI.

Links of interest

Sunday, November 1, 2009

Picking a top or bottom


Many traders try to predict a top or a bottom, but reality reveals this to be a futile attempt and one which mostly ends with considerable losses.

If you try to buy at the bottom, then most often prices will drop yet even further or the stock will trade sideways which automatically means dead money for a long time.

If you attempt to predict a top then there is always the possibility that you are wrong and the high you had imagined is in fact the low of an ongoing rally to much higher prices.

Thursday, October 29, 2009

BullionVault - Buying Gold online

Gold Bar - Copyright CreativeCommons.orgIt used to be very difficult for private individuals to find a simple, safe and cost-effective way of buying, storing, and then selling gold.

The main problem was the sheer size of the investment you needed to make to access the best prices - and there were extra complications with integrity and storage too.

Direct access to the very best prices
  • BullionVault.com changes all this. It enables people from all over the world to own professional market gold and keep it in any quantity in officially recognized bullion vaults in London (UK), New York (USA), or Zurich (Switzerland).
  • All BullionVault gold is held in Good Delivery form. So when you come to sell, your buyer is able to trust the purity and weight of your gold, which is guaranteed by BullionVault itself because we know that you never had the chance to corrupt it.
  • So the dealing spread is typically 0.4%, about one-tenth of the equivalent cost charged to private customers for gold coins and small bars.
  • You can buy just a small portion of a 400-ounce bar. You can trade on-line in increments as small as 1 gram - currently about $30.
  • BullionVault is not a unit trust / mutual. There is no 5% front end subscription load. When buying gold you pay a commission whose maximum rate is 0.8%, falling progressively when you invest above $30,000 to the spectacularly low rate of 0.02%.
  • Storage charges are down to wholesale rates of 0.12% pa ($4 per month minimum) with insurance included. That's less than a tenth of the storage fees charged by retail banks, and less than one-third the annual fees charged by typical exchange-traded gold funds (ETFs).
  • BullionVault customers also save money because they deal directly with each other, willing seller to willing buyer, by using our order board.
  • You make a further big saving at settlement time too. You don't have to arrange for expensive armoured courier bullion collections.


BullionVault Registration
To register go to the main page of BullionVault. On it you have to enter your own user name. I will use a fictional user name to go through these steps.

BullionVault Registration Form
BullionVault Registration
As you can see, I've entered my details, the user name I want to use, my own email address and a decent password. Next you have type over the three random numbers or letters that are generated. That is done to make sure it is a real person doing the registration and not a computer program. Last, you need to agree with the terms and conditions and you can submit the form.

Registration Completed
After clicking submit you will be brought to this screen confirming you your account was successfully created. Congratulations! You have made your first steps to becoming an actual gold trader. Now click on login to enter your details.

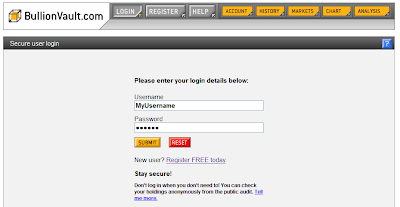
BullionVault Login
BullionVault Login
Fill in your user name and password.

BullionVault Account Balance
After securely logging in to BullionVault you will be taken to the Account Balance screen from which you can see you current balance in the currency in which you made the deposit of course. From this screen you can pretty much do everything from watching the prices, charts, buy gold, sell gold, deposit funds and basically everything one needs to trade gold.

BullionVault Markets
Clicking on the markets button brings you on the screen where you buy or sell gold. It shows the best bids and the best offers. Trading gold was never this easy. Those interested in doing a bit of trading and not knowing how then I suggest checking out BullionVault. They also have a pretty detailed help page and a help demo which guides you through everything.
Buy gold online - quickly, safely and at low prices

Wednesday, October 28, 2009

Closing trades: UTS Energy Corp and Open Range Energy

We close UTS Energy Corp and Open Range Energy Corp. These made a profit of 9.38% and 6.47%. UTS Energy Corp rose to more than 15% but I will put this lower result on the board. Probably these stocks will gain more profit, but I see a lot of stocks move lower and a lot of people are taking profits, so better keep what you have then loose more of your profits.

Keep remembering what I said: "take profit when you". It it is better to make a lot of small wins, that is more realistic and these all added up make also a large number!

Marketclub - UTS Energy Corp Trend Analysis
Marketclub - Open Range Energy Corp Trend Analysis

Links of interest

Wednesday, October 21, 2009

Is the NASDAQ Now in Thin Air?

Fibonacci Retracement (Video)We have seen ever increasing stock prices since March, but isn't it time for some kind of reversal for the NASDAQ? In the video you can also take a look at the use for the Fibonacci Retracement I talked about earlier.

Watch the video

I also posted a video for the S&P 500 that may reverse that you can have a look at.

Tuesday, October 20, 2009

Is the S&P 500 about to reverse?

'Is the S&P 500 about to reverse?' VideoHere is a new video about the S&P 500. I post this because I also think that there has to come some kind of reversal in the markets. We are getting at some very dangerous price levels in a lot of markets so watch out if you are still long.

Article
There’s no question about it, the markets can be very difficult at times. On the other hand, you can laugh all the way to the bank if you approach the markets in a systematic way.

I was looking once again at the S&P 500 and many people have said the market has gone up, not on the fundamentals, but on the perception that things are going to be better. Perception is one of the most powerful elements of the market. I would say that perception trumps both the fundamental and technical.

So what’s going to happen to the S&P 500? Is it going to continue going higher for the rest of the year, or are we close to a turning point?

In my new short video, I outline several key areas that this market is fast approaching. These levels could be the Achilles heel for this market and potentially set the direction for the rest of the year.

Watch the video

As always, the videos are free to watch and there is no need to register.
Enjoy the video, all the best.
Adam Hewison
President, INO.com
Co-founder, MarketClub


Links of interest

Monday, October 19, 2009

Amazing results of trade alerts


We started this blog in August 2009 and already we have had some good results for our trade alerts. You can see them all at the right under results. All the trades were closed with a profit and there are still running a few trades that each day make more profit for you.

We will not say that we are the best, or promise you every week a new trade with a lot of profit. We just do our best to search for promising trades and put them on our blog.

In the results we don't look at transaction costs, or spread or whatever other costs there are. We just calculate the difference between the price of the stock/commodity when we gave the alert and when we closed the alert. So the results are to be interpreted keeping that in mind.

But the main topic of this blog is to become a better trader. And we enjoy learning more about trading, and when we get better we will write more articles that can help you get better at trading. We have a lot of articles on our mind, and we will add these over time.

Links of interest

Update UTS Energy Corp


UTS Energy Corp is trading at 2.09 and got you a profit off +9.38%. We saw the MACD cross over and the RSI is getting near the overbought zone, but there is still a huge upside potential, the next stop will be around 3$ if all goes well. Now we are trading around the 23.6% Fibonacci level and 3$ is around the 38.2% Fibonacci (2.88$).

Click to get the current trend for UTS Energy Corp.

Chart courtesy of: Market club tools for the trader

Links of interest

Saturday, October 17, 2009

Update Wheat future december 2009 contract long


Prices ran up to a high of 529$. That is a nice profit of 7.08% or 31% with the leverage of 4.43.

And since I told you that if you have a lot of profit in such a short time and we were going into the overbought area, what do you do then? Well any answers, yes, we exit the trade, that is what we do.

Or you closed the trade on the 14th of October when it was climbing and you had more than 25% profit. Or you closed the trade when you saw the long-legged doji. This doji occurred outside of the Bollinger bands and mostly this together with a sell signal on the Slow Stochastics indicates a reversal.

Friday, October 16, 2009

Trade alerts

Break out for Crude Oil


The price of oil has been in a trading range (60$ to 75.55$) for months and now Crude Oil broke out and is trading at 78.7$. The trend has been up since May. Crude is getting a bit overbought so for a possible entry we will wait for a pullback.

Do you have a nice trade in mind then please share it with me and post a reply. I wish you all the best in your trading adventures!

“The Perfect Portfolio”

I added this article written by Market Club because I use the Market Club trader tools. I also started checking out a video and after that I wanted to try their tools (30 days risk free trial).


Is there such a thing as a perfect portfolio? Maybe or maybe not, but there are certain times, and this is one those times, that it is practically a no brainer in how to make money in the market. That is why we call this approach “The Perfect Portfolio”.

It doesn’t matter if you have $10,000 or $10,000,000. It’s all percentages and this approach has averaged 6% a month over the last 42 months in some of the toughest economic time on record.


Right about now you might be saying to yourself, “Man this has got to be super risky and they must be swinging for the fences or using some highly speculative option plays, or worse yet, futures.” It is none of these. In fact, the approach downright conservative and in some cases only makes 1 trade a year. Now I understand that this is not going to make your broker happy, but whose money is it anyway?!

Okay, let’s get started. This is a two part video and I promise I will show you how these gains were generated and how you can easily replicate this approach. No one can guarantee 6 percent per month returns, but what I can guarantee is that this approach is proactive. There are very few trades and it works!

Let me tell  you about the perfect portfolio in this video.
'The Perfect Portfolio' Video

Buy gold online - quickly, safely and at low prices